
Overview
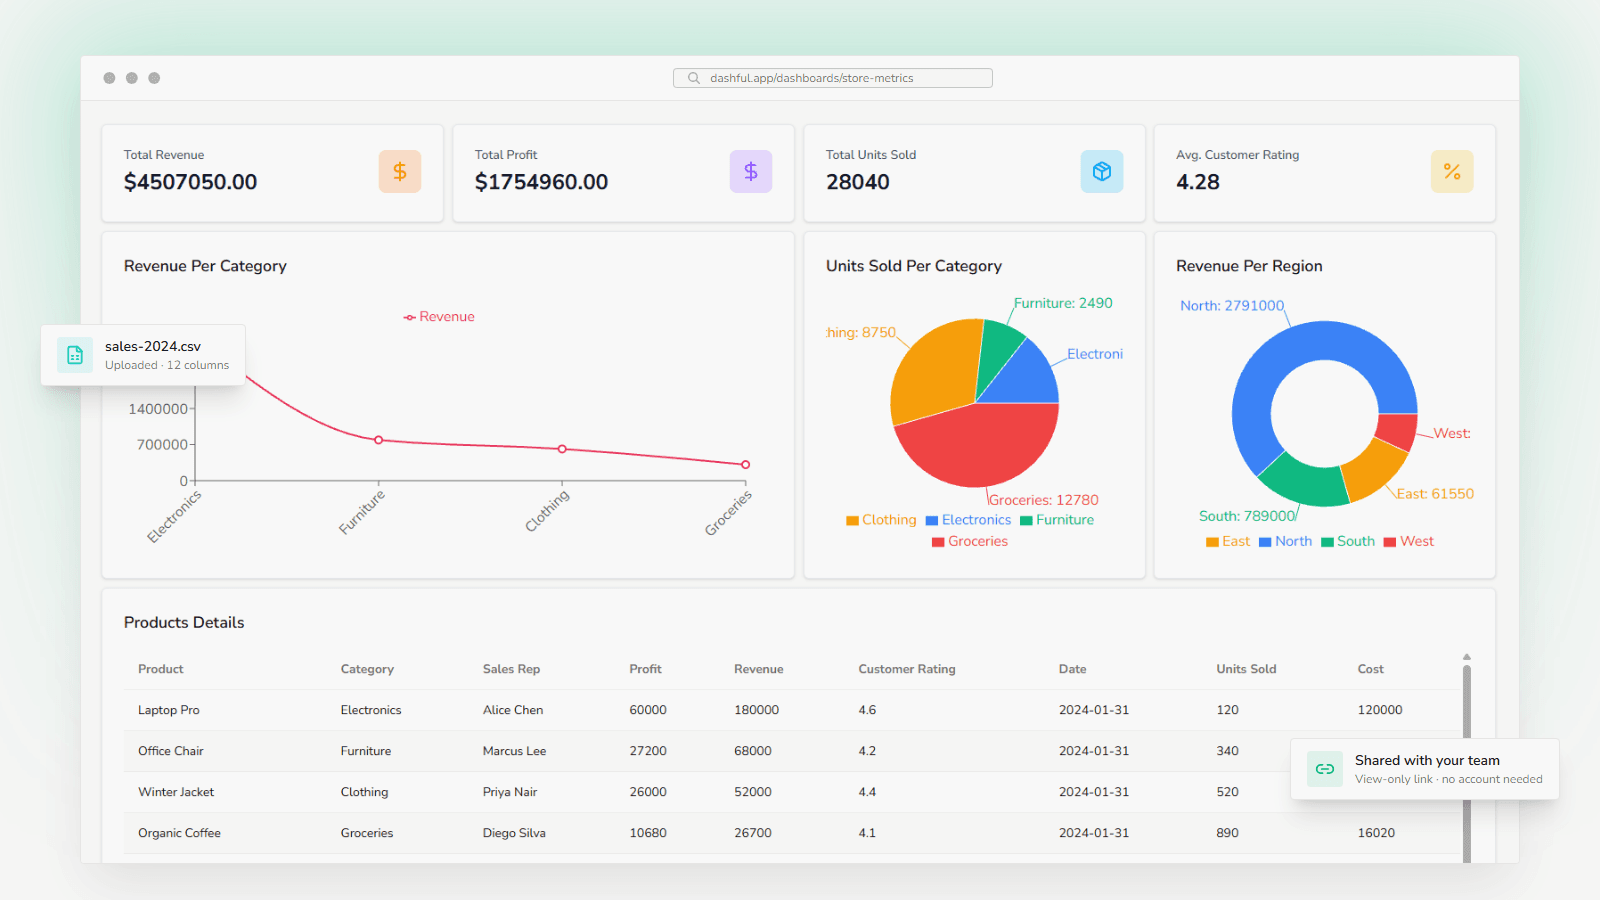
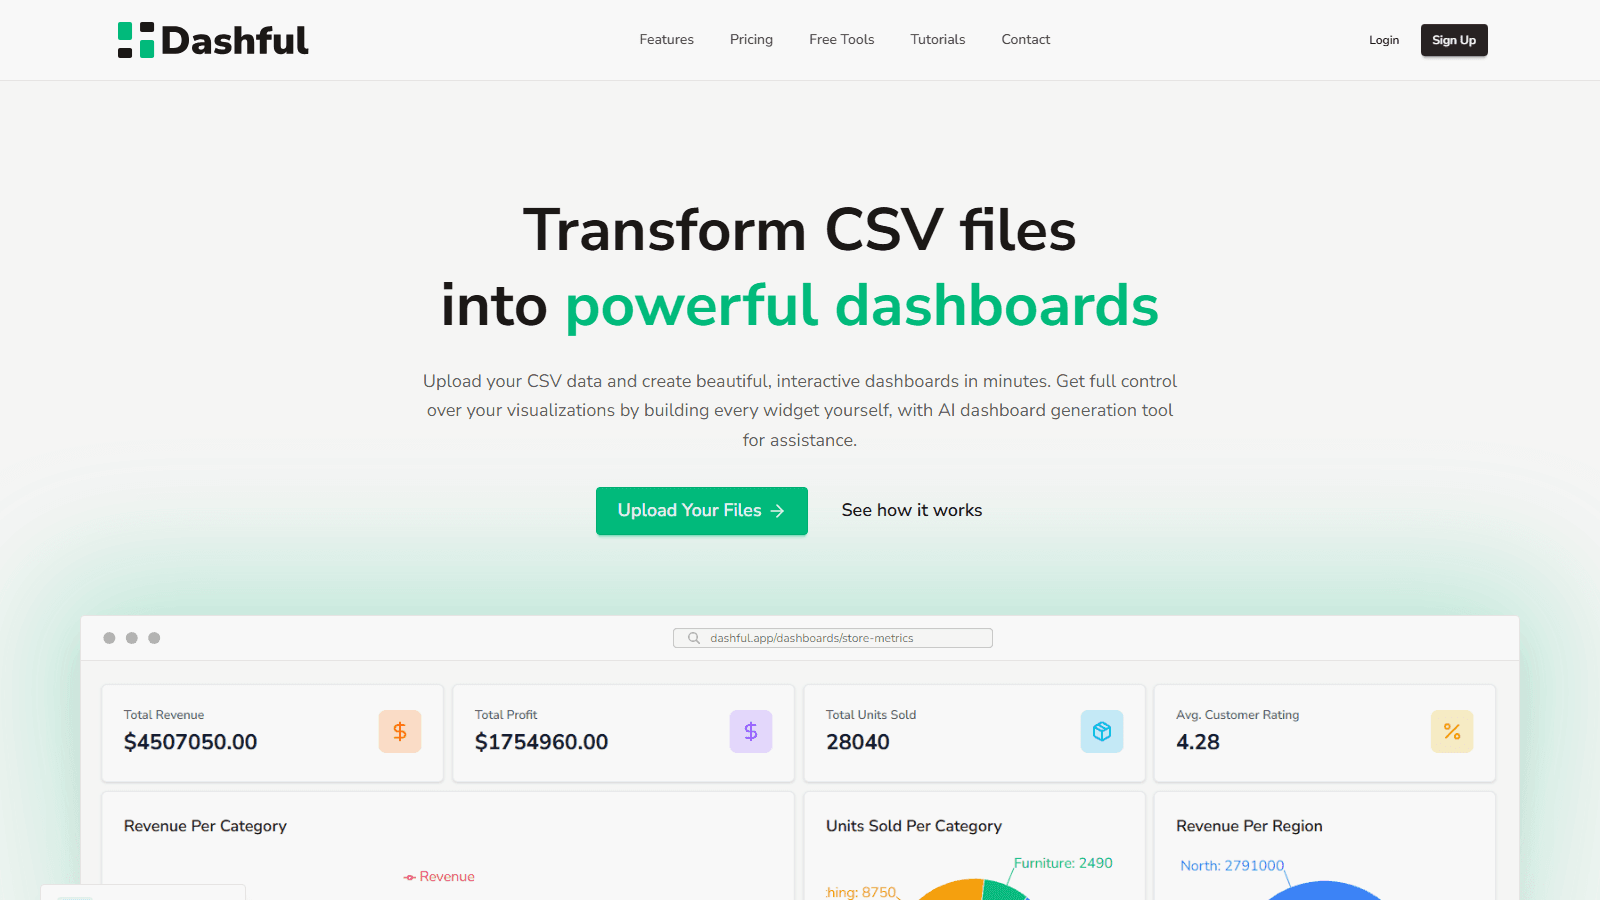
Dashful is a SaaS web app that turns CSV files into interactive dashboards. Users upload their data, build charts, metric cards and tables on a drag-and-drop canvas, and share a view-only link with their team, all without writing code or paying for an expensive BI tool.
Key Features
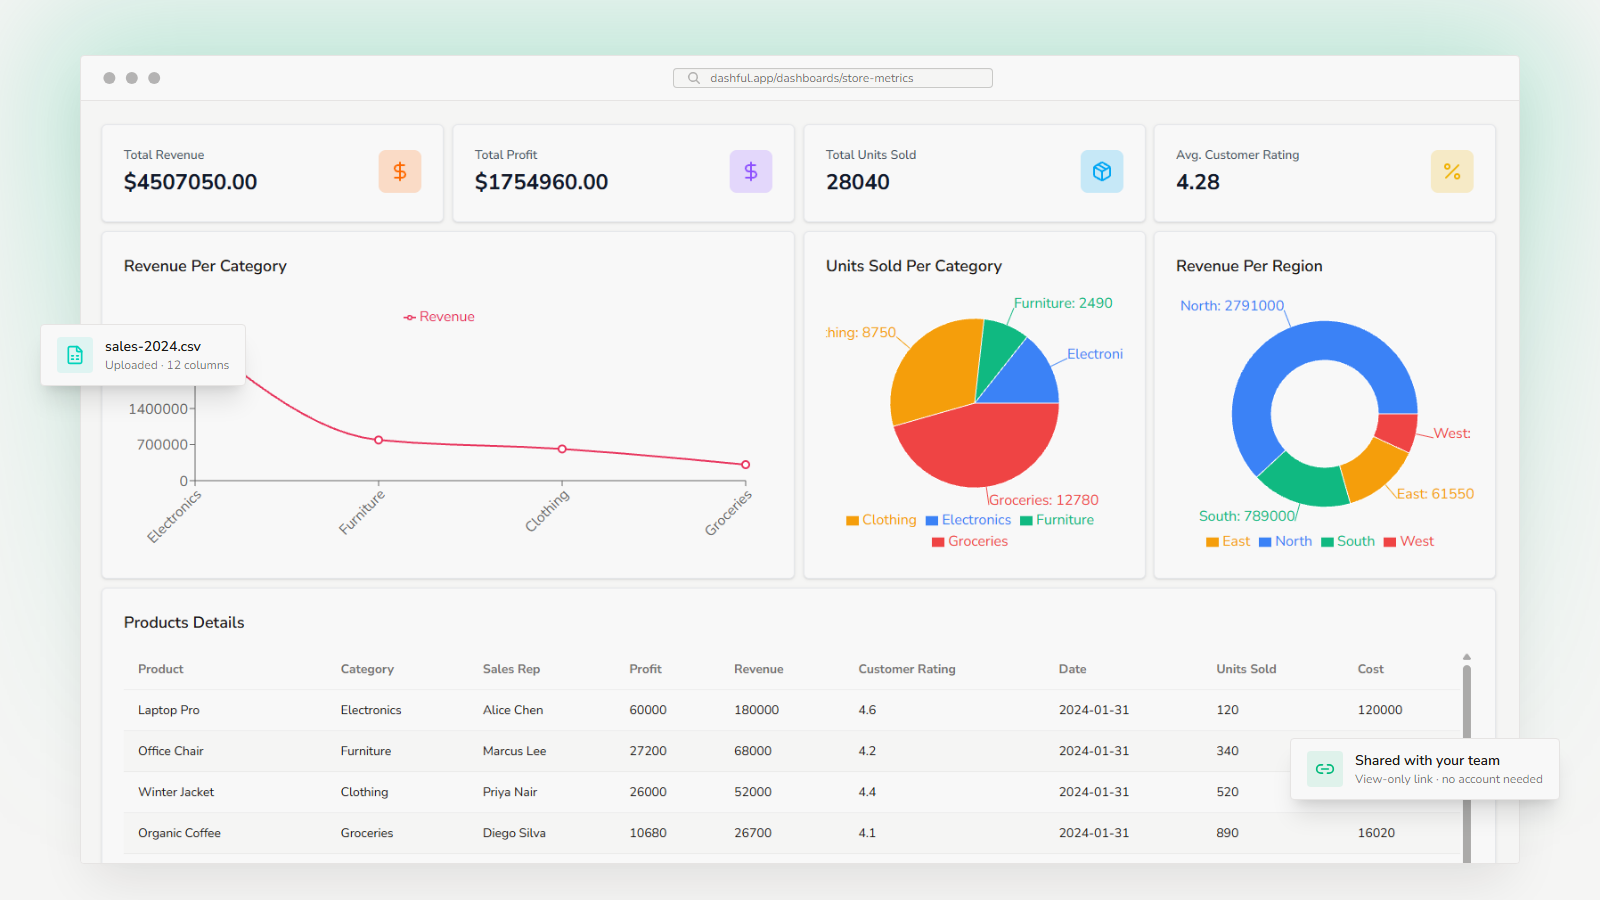
- CSV upload: Drag and drop CSV files and use several data sources in a single dashboard.
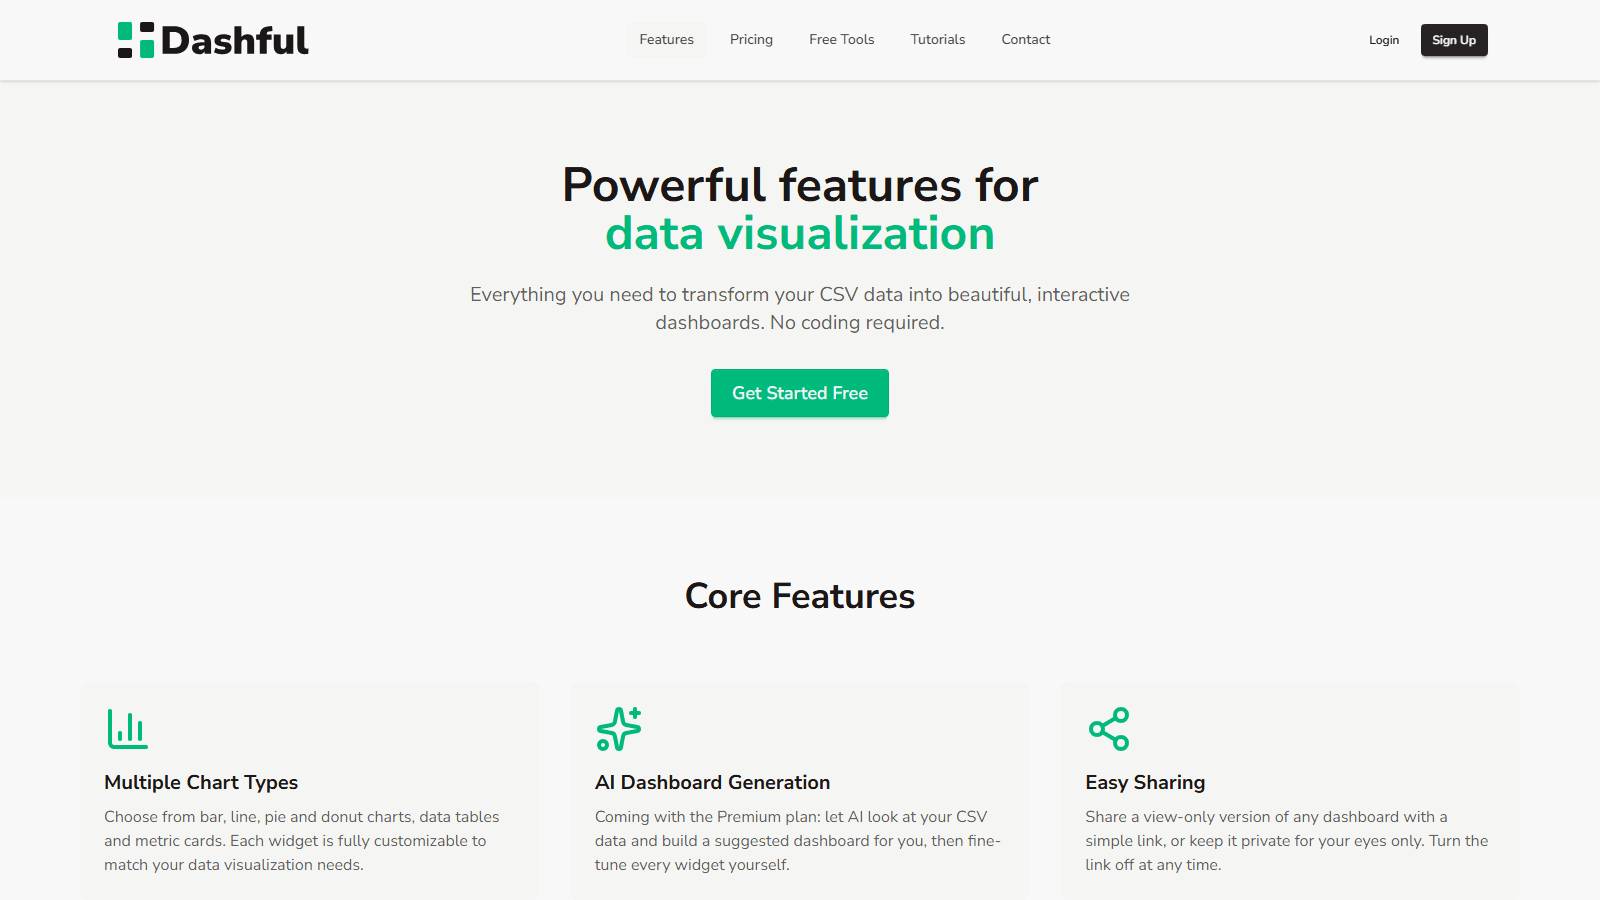
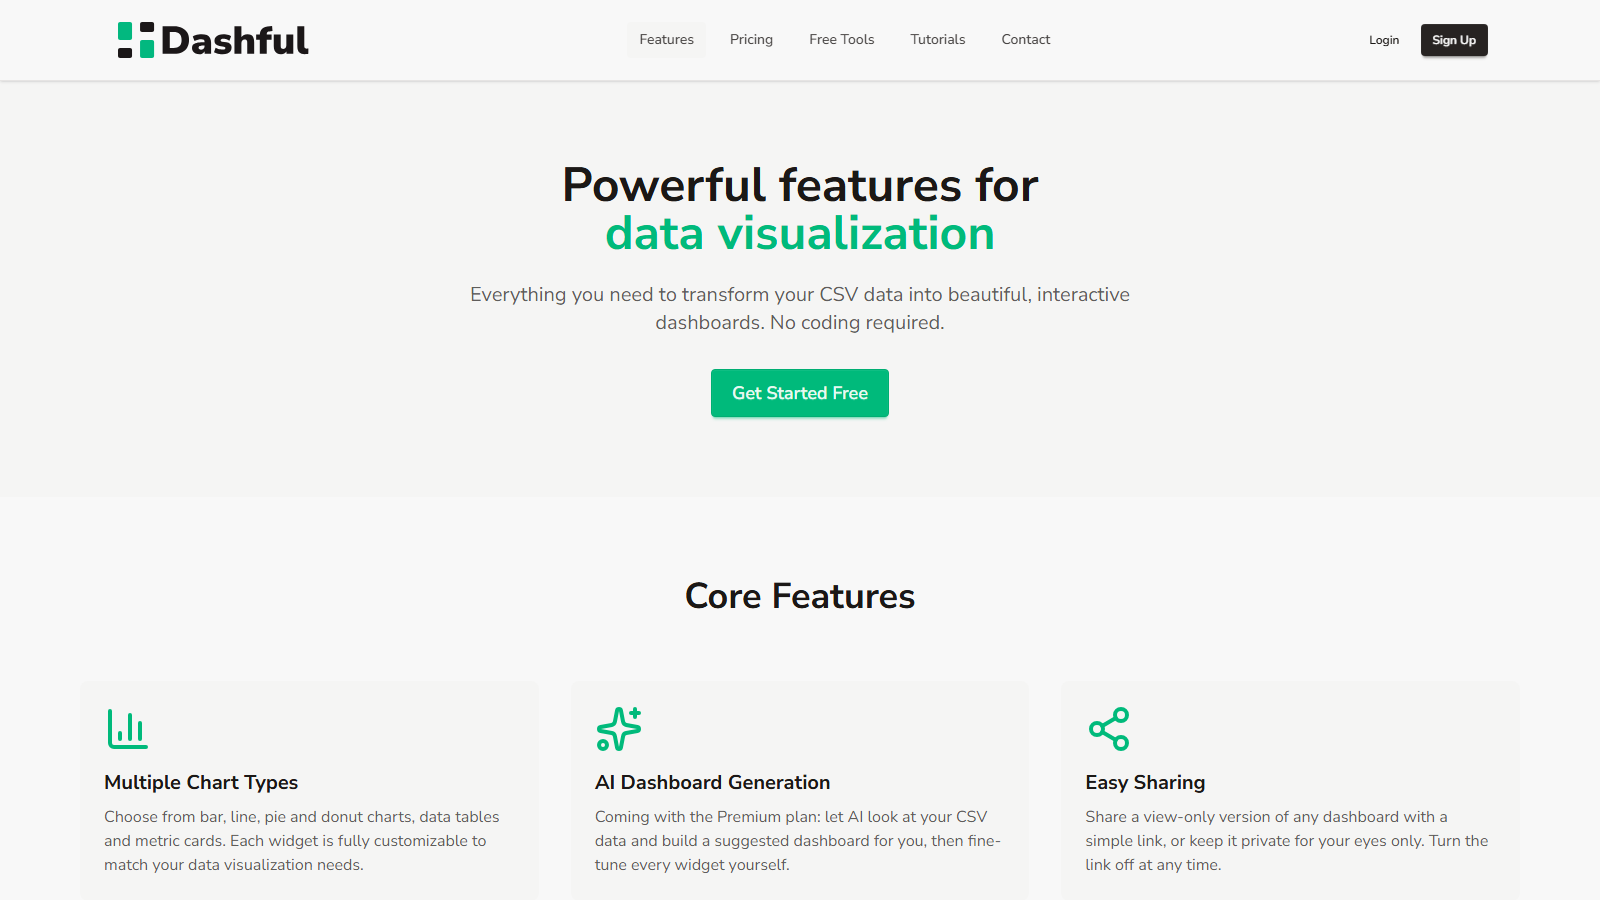
- Widget builder: Line, bar, pie and donut charts, metric cards and data tables, each fully configurable.
- Flexible layouts: Drag, resize and position widgets on a grid.
- Automatic type detection: Dates, numbers, categories and text are recognised automatically.
- Sharing: Publish a view-only version of any dashboard with a link, and turn it off at any time.
- Export and import: Save dashboards and restore or duplicate them later.
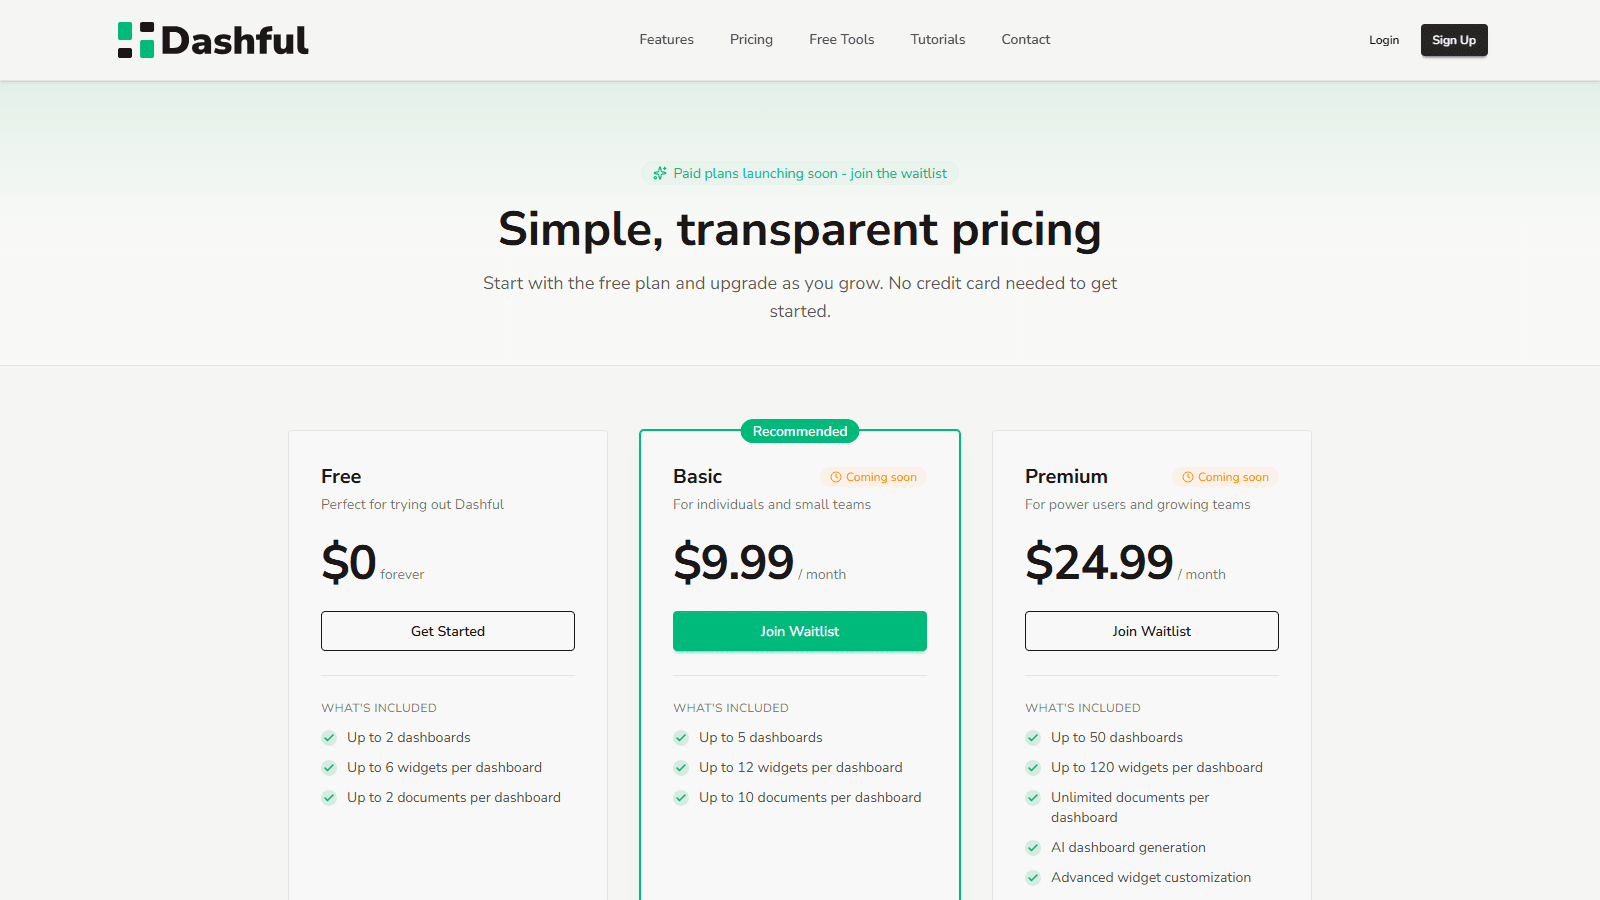
- Plans and billing: Free and paid plans with limits on dashboards, widgets and documents.
Technologies Used
- React & TypeScript: The front-end application.
- TanStack Router: File-based routing for the app and marketing pages.
- Tailwind CSS & daisyUI: UI components and styling.
- Recharts & React Grid Layout: Charts and the drag-and-drop dashboard canvas.
- AdonisJS & PostgreSQL: The API backend, with authentication, email verification and role-based access.
- Polar: Subscription checkout for the paid plans.
Challenges and Learnings
The main challenge was making the dashboard builder flexible enough to handle any CSV structure while keeping it simple for non-technical users. Detecting column types reliably and mapping columns to the right widgets took the most iteration.
Outcome
Dashful is live with a free plan. Paid plans and AI dashboard generation are on the way.